I was teaching scatter diagram to some of my students the other day. A few of them are a bit confused with correlation and causation. I gave them the typical ice cream and murder rates example, which I shared here when I discussed about the r-value.
Think of correlation like a trend, it simply can be upwards, downwards or no trend. And since we only discuss about LINEAR correlation here, strong and weak simply is with respect to how linear it is, that means how close your scatter points can be close to a line.
Since A’levels, do ask students to draw certain scatter during exams to illustrate correlation. Here is a handy guide.
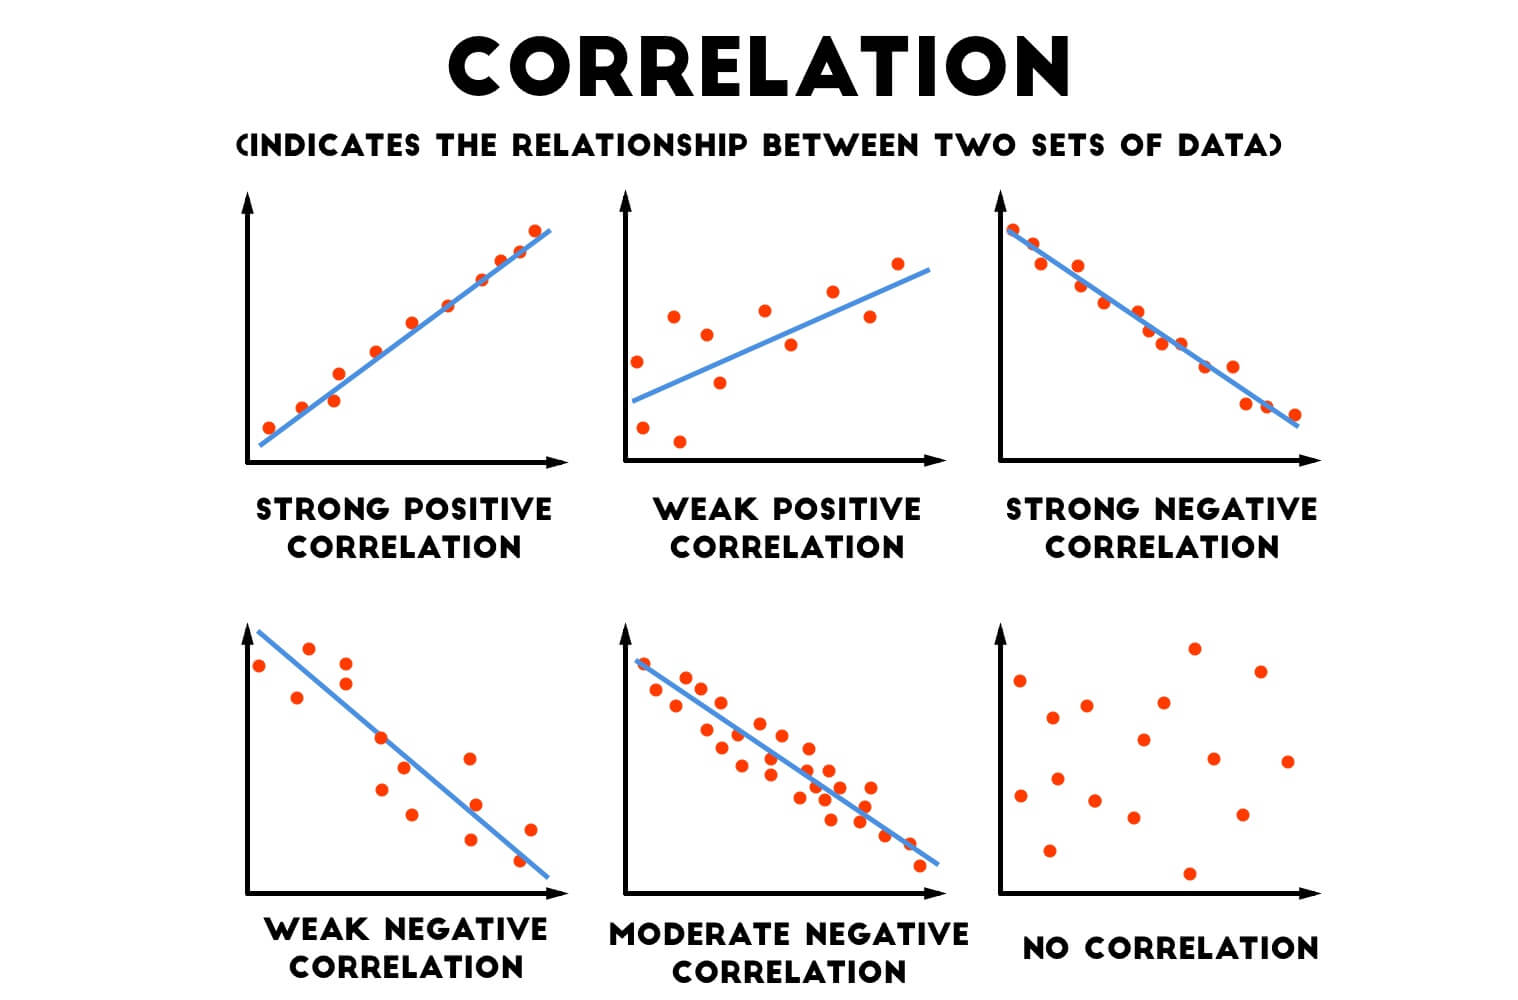
Scatter Diagrams
Credits: pythagorasandthat.co.uk