Today, we shall look at regression estimation. We will begin by looking at the usual & simple straight line regression model:  . Let
. Let  and
and  by the ordinary least squares (OLS) regression coefficients of the slope and intercept.
 =
=  =
= 

Precision is increase, that is 
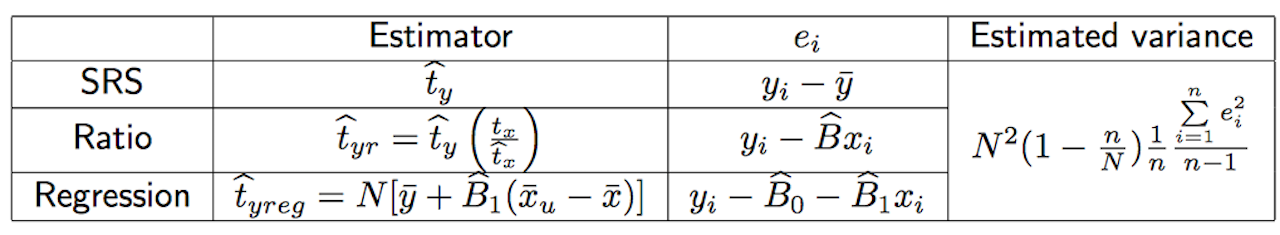
Different estimators for population total
We conclude here by observing that ratio or regression estimators give greater precision that  when
when  for the method is smaller than
Sampling & Survey #1 – Introduction
Sampling & Survey #2 – Simple Probability Samples
Sampling & Survey #3 – Simple Random Sampling
Sampling & Survey #4 – Qualities of estimator in SRS
Sampling & Survey #5 – Sampling weight, Confidence Interval and sample size in SRS
Sampling & Survey #6 – Systematic Sampling
Sampling & Survey #7 – Stratified Sampling
Sampling & Survey # 8 – Ratio Estimation
Sampling & Survey # 9 – Regression Estimation
Sampling & Survey #10 – Cluster Sampling
Sampling & Survey #11 – Two – Stage Cluster Sampling
Sampling & Survey #12 – Sampling with unequal probabilities (Part 1)
Sampling & Survey #13 – Sampling with unequal probabilities (Part 2)
Sampling & Survey #14 – Nonresponse