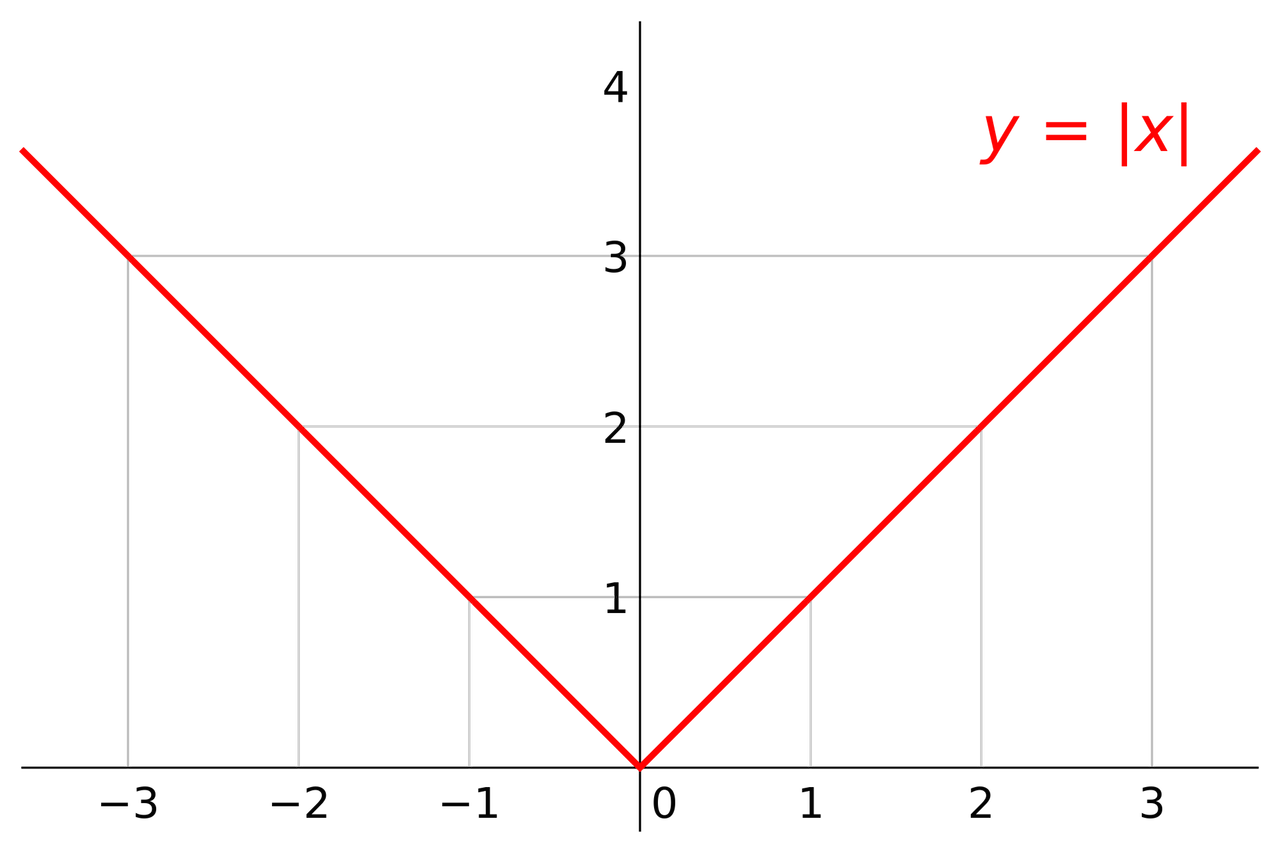
So now let us look at a simple relationship that many students memorise instead of understand. Below, we see a absolute function graph.
Credits: Wikipedia
Now we all know that  gives us
  . So how did that happen? Consider drawing a horizontal line,
  in the graph above.
  is less than
  only when . Similarly,
  is true only when
  or
or  . I do hope that the graphical representation helps here.
[…] 19. Difference between H1 and H2 Math 20. Partial Fractions made easy 21. The Modulus Sign #1 22. The Modulus Sign #2 23. The Modulus Sign #3 24. The Modulus Sign #4 25. An easier approach to remembering discriminant […]