All solutions here are SUGGESTED. Mr. Teng will hold no liability for any errors. Comments are entirely personal opinions.
(i)
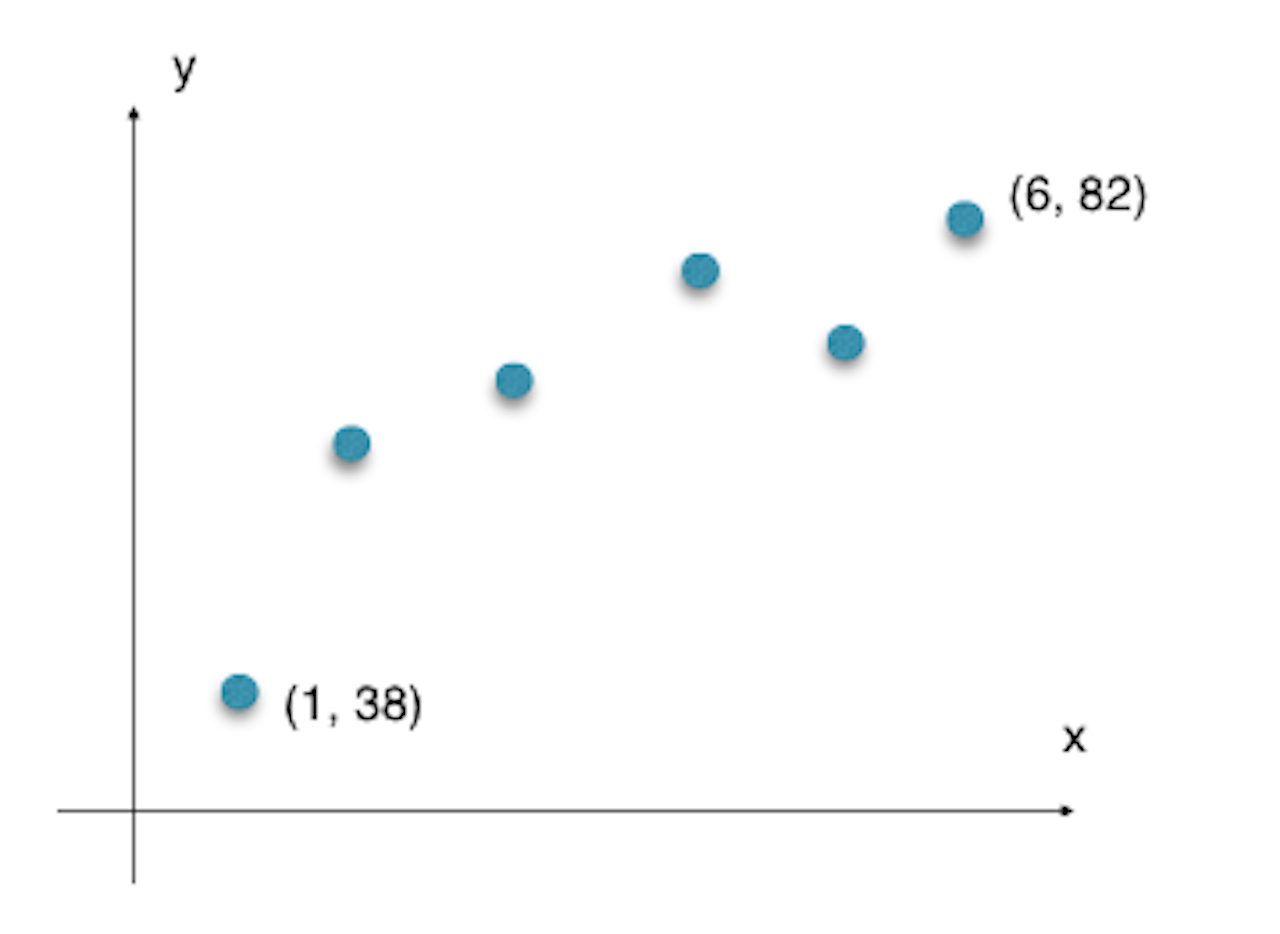
Graph for 8(i)
(ii)
Marks in week 1 do not follow the trend. Amy might not be well prepared in the first week.
(iii)
Marks cannot exceed 100, and a linear model which models a proportionate upward or downward trend of data, is not appropriate here since it will suggest that scoring more than 100 marks is possible.
A quadratic model will have a maximum (minimum) point, which suggests that marks will increase (decrease) and then suddenly decrease (increase). This is highly unlikely and thus not appropriate since mark should plateau off at 100 at best.
(iv)
For 
(v)
Since  is closest to 1 for
  , this is the most appropriate value for L.
(vi)
From Graphing Calculator, 


Amy will obtain at least 90% in week 13.
(vii)
L is the percentage mark she will get if she continues to practice indefinitely.
KS Comments:
As usual, students need to label the minimum and maximum point of the scatter point. There are definitely other qualitative answers to (ii), (iii) and (vii). Students can feel free to comment and discuss.