Since many students were asking, I thought I’ll roughly explain the bell curve and its distribution properties.
Before that, I thought I should mention that I’m not really sure myself if Private Candidates and School Candidates share a different bell curve. I doubt so, since all take the same subject code, there should be no differentiation as there will be bias. And I do not really see a particular need for them if all the students take the same paper. There is no differentiation between taking the paper again and first time too, it doesn’t mean that you take it twice, you have a higher chance/ lower chance. They should be competing in all fairness still.
A bit of intuition of how this bell curve thing works. We can’t have too many A’s. If ALL the JC students were to score zero mark and no student deviate (cheat), then all of you will get A. Similarly, if God answered all your prayers and ALL JC student were to score full marks, then all will get A. The curve attempts to distribute proportionally the results of everybody based on the marks, and place you in the correct percentile (probability).
Logistics wise, you can click the link above which gives us a normal distribution. Here, you can input the Mean and Variance so you can create your own bell curve. I can’t really advise the mean and variance score since I have no data. Its really why we only see letter grade.
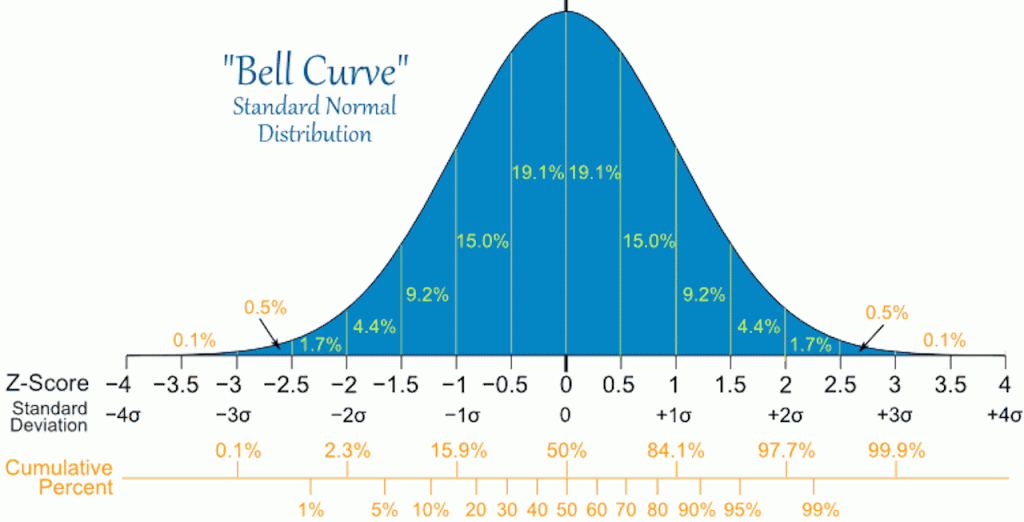
Next we look at the bell curve

Credits: Google
First of all, this is a standardised normal, the ![]() curve that you all know. To simplify things, just consider the cumulative percent at the bottom. 80% means you 80th percentile, and that in general warrants an A I’ll say. So consider we have 20 or 21 JC (I don’t know), each having approximately 700 students taking, we can find the population size. From here we can then take a percentage and figure out how many A’s are available.
curve that you all know. To simplify things, just consider the cumulative percent at the bottom. 80% means you 80th percentile, and that in general warrants an A I’ll say. So consider we have 20 or 21 JC (I don’t know), each having approximately 700 students taking, we can find the population size. From here we can then take a percentage and figure out how many A’s are available.
Next, what does it mean when the bell curve shifts?
What we see above is a Normal curve centred about 0 (mark), and we know that Normal curve is centred about ![]() (mean/ modal mark). So if you can figure out the mean mark, by taking a sufficient sample size of students and how they did (we lack the information here since we only receive letter grades), we can that find the unbiased estimate of the population mean. And then the unbiased estimate of the population variance, which is crucial too.
(mean/ modal mark). So if you can figure out the mean mark, by taking a sufficient sample size of students and how they did (we lack the information here since we only receive letter grades), we can that find the unbiased estimate of the population mean. And then the unbiased estimate of the population variance, which is crucial too.
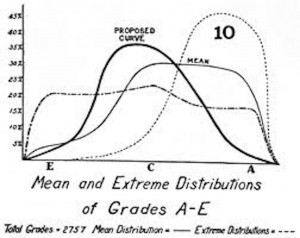
Now since we all squeeze into the same bell curve and due to some friends scoring full marks or near full marks, yes there are definitely students that have full marks in a few particular JCs, I know a handful of my students above 90 actually… This results in the mean mark shifting to the right. And in general, the curve should not shift left, at least not in our society. We are Asians.
Here is why, it is really impossible to say what’s the range for A unless you can confidently tell me the population mean and variance. But I do consider the case of 25% of students should get an A.
I hope this clarifies a bit. And yes, this is what you guys actually learnt in A-levels, if you understood your content of course as what I’ve explained in class before. To spice things up, we can also perform hypothesis testing (simple case can be just with ![]() , while we should also look at
, while we should also look at ![]() )to see if the
)to see if the ![]() we found is the best unbiased estimate. And something out of syllabus will be to test if
we found is the best unbiased estimate. And something out of syllabus will be to test if ![]() is also best unbiased estimate. The word Best adds one more criterion for our estimate actually.
is also best unbiased estimate. The word Best adds one more criterion for our estimate actually.
Now you can go at play with the above link and fit in what you believe the mean and standard deviation is, and then you can calculate the percentile (probability) you are in by putting the score you think you have.
Take note the standard deviation should be not go too big, as we can’t have people scoring more than 100. 100 marks should be ![]() away from
away from ![]() .
.
Again, please don’t ask me whats the ![]() and
and ![]() . I don’t want to advise such things. You can open your sampling notes, perform stratified sampling then collect unbiased estimates of population mean and variance yourself, and put what you learnt to real (finally) use.
. I don’t want to advise such things. You can open your sampling notes, perform stratified sampling then collect unbiased estimates of population mean and variance yourself, and put what you learnt to real (finally) use.
If you’re lazy, then just check what’s your school percentage of A then consider the population of your school, that roughly how well you will do. 🙂 I usually say this in class, that if your school delivers 50%, then you need to find a friend to not do well at least.
My take for the bell curve is that the bell curve will always help the best students. As for it helping the weaker students, it is highly dependent on the cohort on the whole and the difficulty of the paper. Consider me scoring 90/100 marks and everybody else scores above 95 marks, I’ll be the weakest and will end up failing. I hope these does not discourage or crush the confidence. Remember that there is a paper 2 still, with equal weightage.
So I took this image of google, it does not represent the A-levels. Please take note. But this is what happens when too many students do well. If you’re keen, you can read more on skewed normal distribution independently. I might do more on Stat 101 here when I’m free.

[…] A little on Bell Curve […]