All solutions here are SUGGESTED. Mr. Teng will hold no liability for any errors. Comments are entirely personal opinions.
(i)
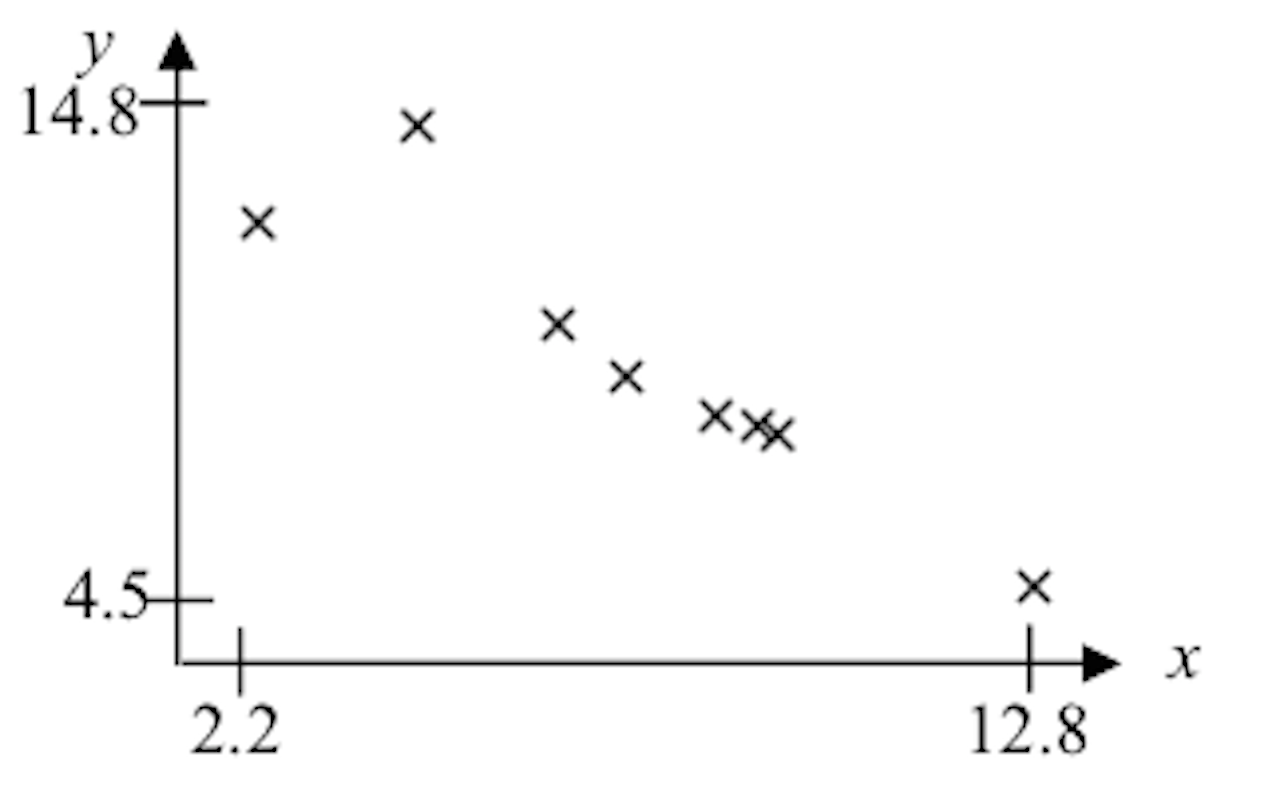
Scatter Diagram
(ii)
Using Graphing Calculator,  .
.
Since  is close to 1, there is a strong negative correlation between the number of hours spent travelling to and fro work and the number of hours spent watch television.
(iii)
Using Graphing Calculator, equation of regression line of  is
is 
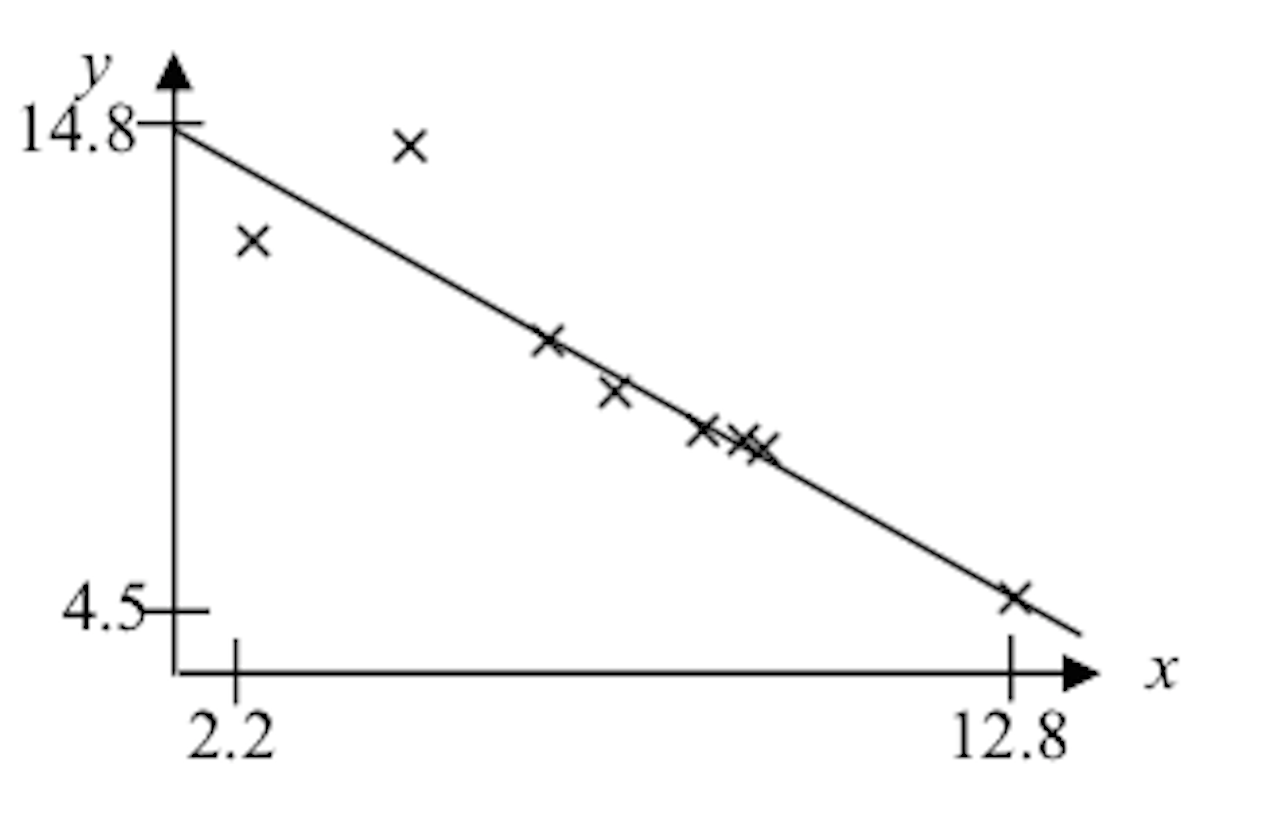
Scatter Diagram with Regression Line
(iv)
When  hours
hours
The estimate is not reliable since  is outside the range of sample data.
KS Comments
Students must check what they key in very carefully. And for the drawing of regression line, students must learn how to store them properly so as to draw as precisely as possible.