All solutions here are SUGGESTED. Mr. Teng will hold no liability for any errors. Comments are entirely personal opinions.
(i)
(ii)
Using the Graphing Calculator, ![]()
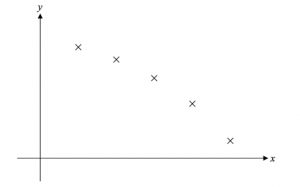
The product moment correlation coefficient measures the strength and direction of a linear relationship between two variables. Thus, the r-value only indicate correlation, but not causality. It is possible for the relation to be non-linear, and yet have a value close to 1. We need to look at the scatter diagram to determine whether the relationship is truly linear.
(iii)
Using ![]()
Using ![]()
Since ![]() is close to 1. We conclude that
is close to 1. We conclude that ![]() is the better model.
is the better model.
(iv)
Using Graphing Calculator, ![]()
When ![]()
KS Comments:
Some students actually drew the scatter diagram for the given data, which was really strange. The meaning of r-value has to be well understood to answer (ii) well. Some actually don’t know what does least squares regression refer to.


[…] Question 8 […]